Gate Research: ETH Hits New High, BIO Surges on Volume as Small-Cap Rotations Intensify
Crypto Market Overview
According to CoinGecko data, from August 12 to August 25, 2025, BTC remained in a downward channel, with weak rebound momentum. Despite the technical weakness, open interest in BTC futures stayed at elevated levels, indicating that market sentiment has shifted to a more cautious and wait-and-see stance.【1】Going forward, attention should be paid to key support levels and changes in open interest to identify potential reversal opportunities. In contrast, ETH showed strong performance, briefly breaking above 4,900 USDT to set a new high, supported by sustained capital inflows and spot ETF holdings surpassing $30.5 billion. If ETH can hold short-term support levels, the uptrend is likely to continue, with a clearly stronger technical structure than BTC.
Recent developments also reflect a growing trend of institutionalization and cross-ecosystem integration within the crypto market. On the ecosystem front, BenFen and the Stellar Foundation are advancing RWA tokenization; Wormhole is planning to acquire Stargate to enhance cross-chain interoperability; 1inch launched simplified cross-chain functionality; and Bitlayer has emerged as a top performer among Bitcoin Layer 2 projects. Meanwhile, CeFi lending activity is expanding rapidly, and the NFT market is showing signs of recovery.
Overall, the current crypto market presents divergent trends with multi-dimensional momentum. While BTC remains technically weak, capital has not significantly exited. ETH, supported by solid fundamentals, maintains upward strength. At the macro and ecosystem levels, regulatory alignment and cross-chain innovation continue to progress. Combined with active sectors such as Layer 2, RWA, and DeSci, the market continues to offer long-term growth potential and structural opportunities.
1. Overview of Price Performance
This analysis groups the top 500 tokens by market cap to evaluate their average performance from August 12 to August 25, 2025.
The overall average price change during the period was +3.43%, with clear structural divergence across market cap tiers. Tokens ranked 301–400 outperformed all other groups, with an average return of +6.42%, followed by the 401–500 and 1–100 ranges, which posted +4.73% and +4.62%, respectively. In contrast, the 101–200 group underperformed, with a slight average decline of -0.07%.
In general, capital distribution showed a pattern of “large-cap stability + small/mid-cap outperformance.” While large-cap tokens remained relatively stable and formed the market base, small and mid-cap tokens demonstrated higher volatility and upside potential, helping to lift overall market risk appetite. This may signal a market transition from mainstream dominance to a more diversified and narrative-driven allocation phase.
Note: Market cap distribution is based on CoinGecko data, dividing the top 500 tokens into groups of 100 (e.g., ranks 1–100, 101–200, etc.), then calculating the average price change for each bracket from August 12 to August 25, 2025. The 3.43% figure represents the unweighted average across all 500 tokens.
Figure 1: Overall average gain was 3.43%, with the most notable increase seen in tokens ranked 301–400, averaging nearly 30%.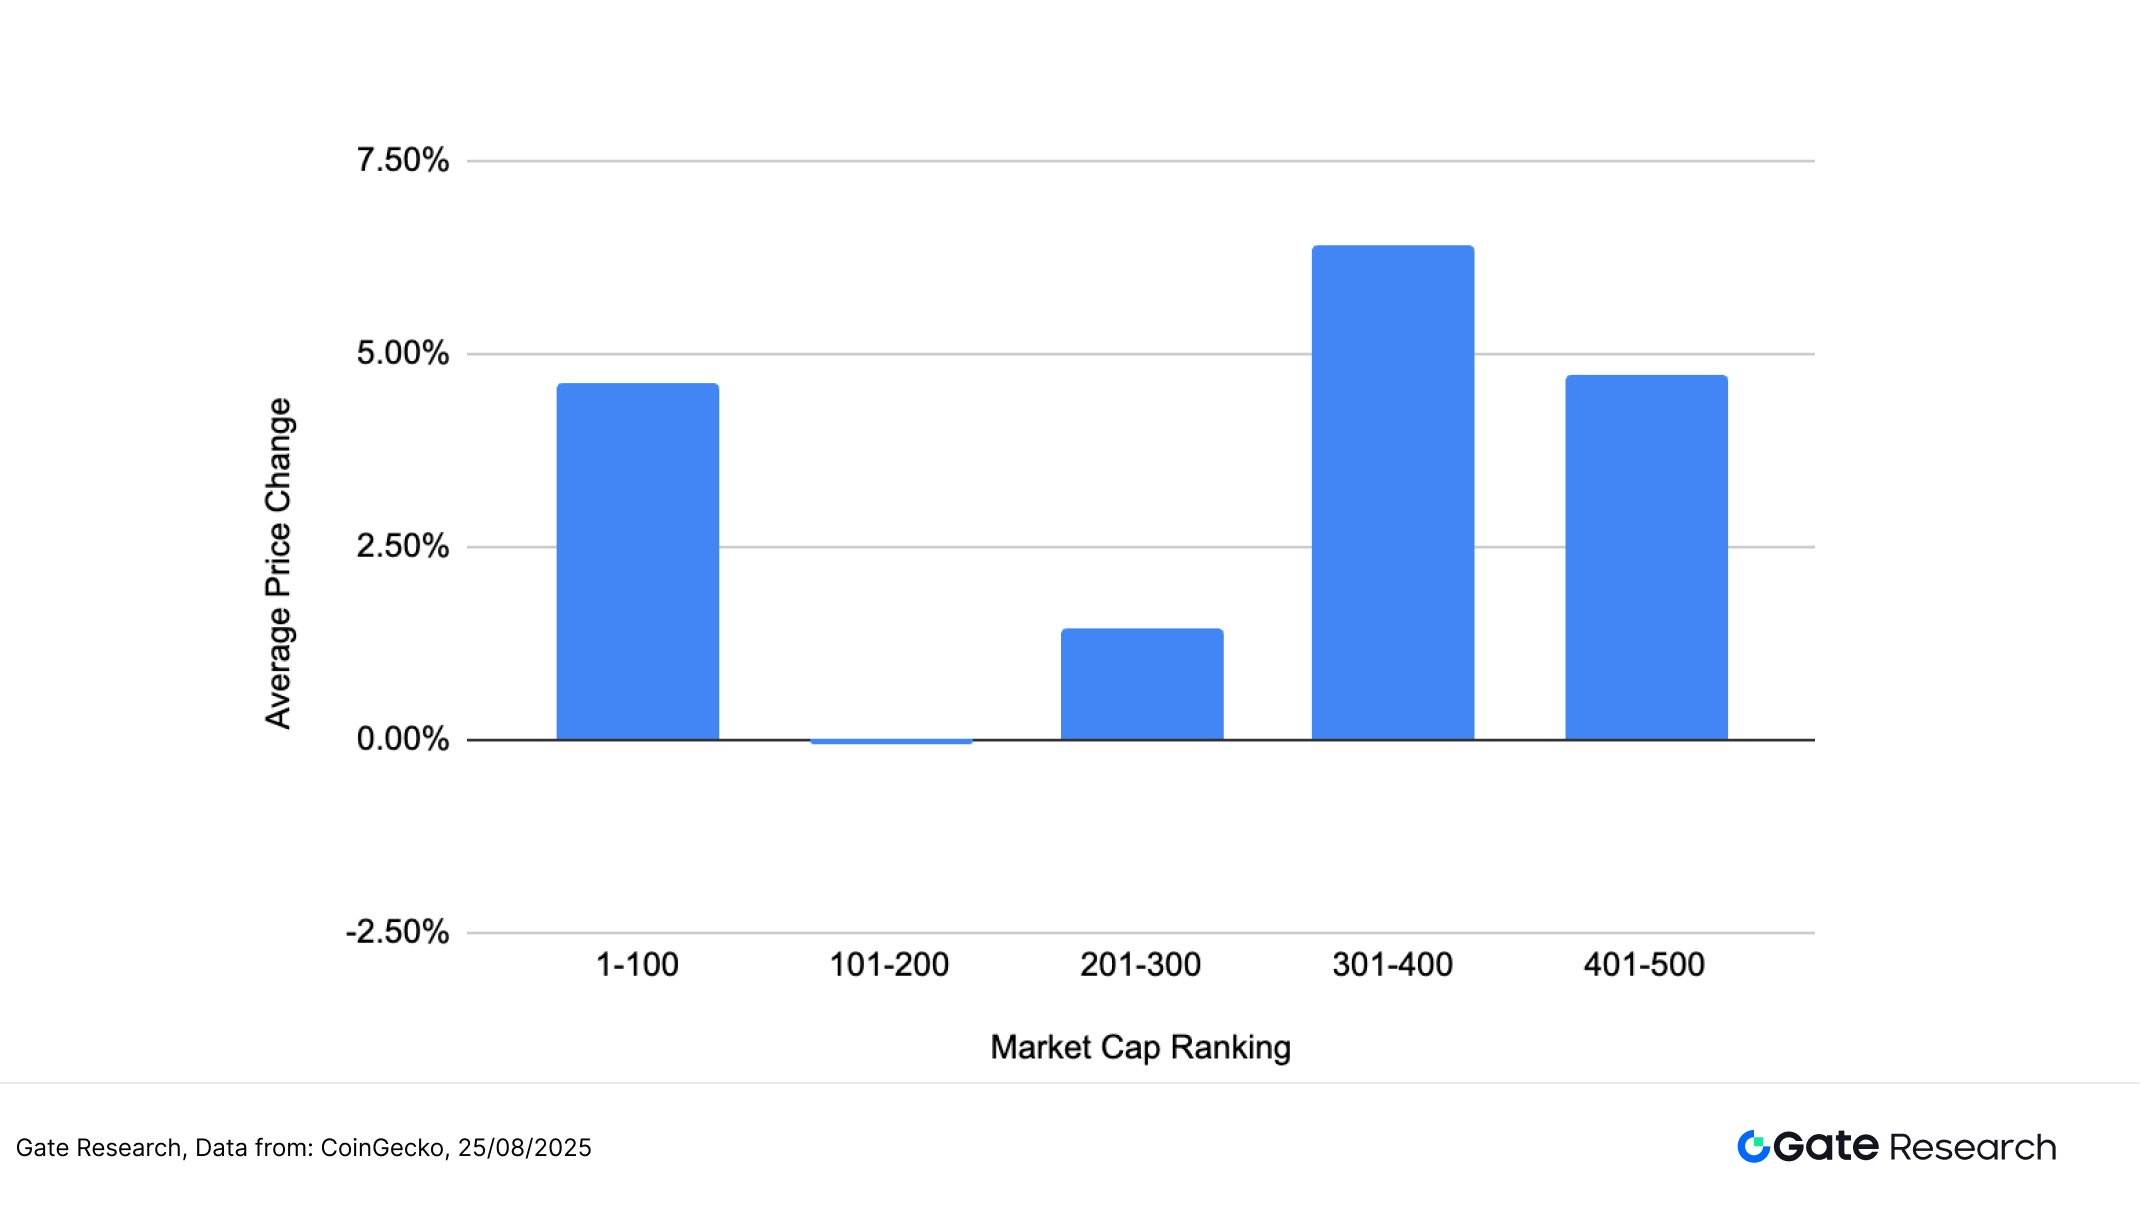
Top Gainers and Losers
In the past two weeks, the crypto market maintained an upward trend with accelerating capital rotation, driving strong rallies in high-volatility small-cap tokens. The top gainers mostly came from meme coins, Layer 1 ecosystems, and emerging narratives, attracting short-term speculative capital due to their strong community engagement and hype potential.
SVL (Slash Vision Labs) topped the list with a +186.95% gain. SVL is the native token of Slash Vision Labs, a Japanese compliant crypto payment platform. The project focuses on integrating digital assets into everyday life, with its Slash Card—the first compliant credit card in Japan supporting crypto—as a key driver of adoption. A pre-registration campaign offering JPY-denominated rewards and revenue-sharing incentives for SVL holders contributed to surging market interest and token performance.【2】
Other major gainers included REX (+182%) and MEME (+128.82%), fueled by ecosystem developments and narrative-driven momentum. Tokens like API3 and BIO also made the leaderboard, boosted by recent product upgrades and growing market focus.
On the flip side, losses were relatively mild. PROVE led the losers with a -35.12% drop, followed by SPK, PTGC, and others with declines between -25% and -32%, mainly due to lack of supporting narratives or fading momentum.
Overall, market style is skewed toward high-beta, strong-narrative assets, with capital favoring tokens with active user engagement and storytelling potential. Projects lacking liquidity or hype are at risk of marginalization, and sector rotation remains the dominant short-term theme.
Figure 2: The best performer was SVL, the native token of a crypto payment platform, which surged 186.95% over the past two weeks — likely driven by the promotion of its crypto asset-backed credit card and an incentive mechanism offering revenue sharing.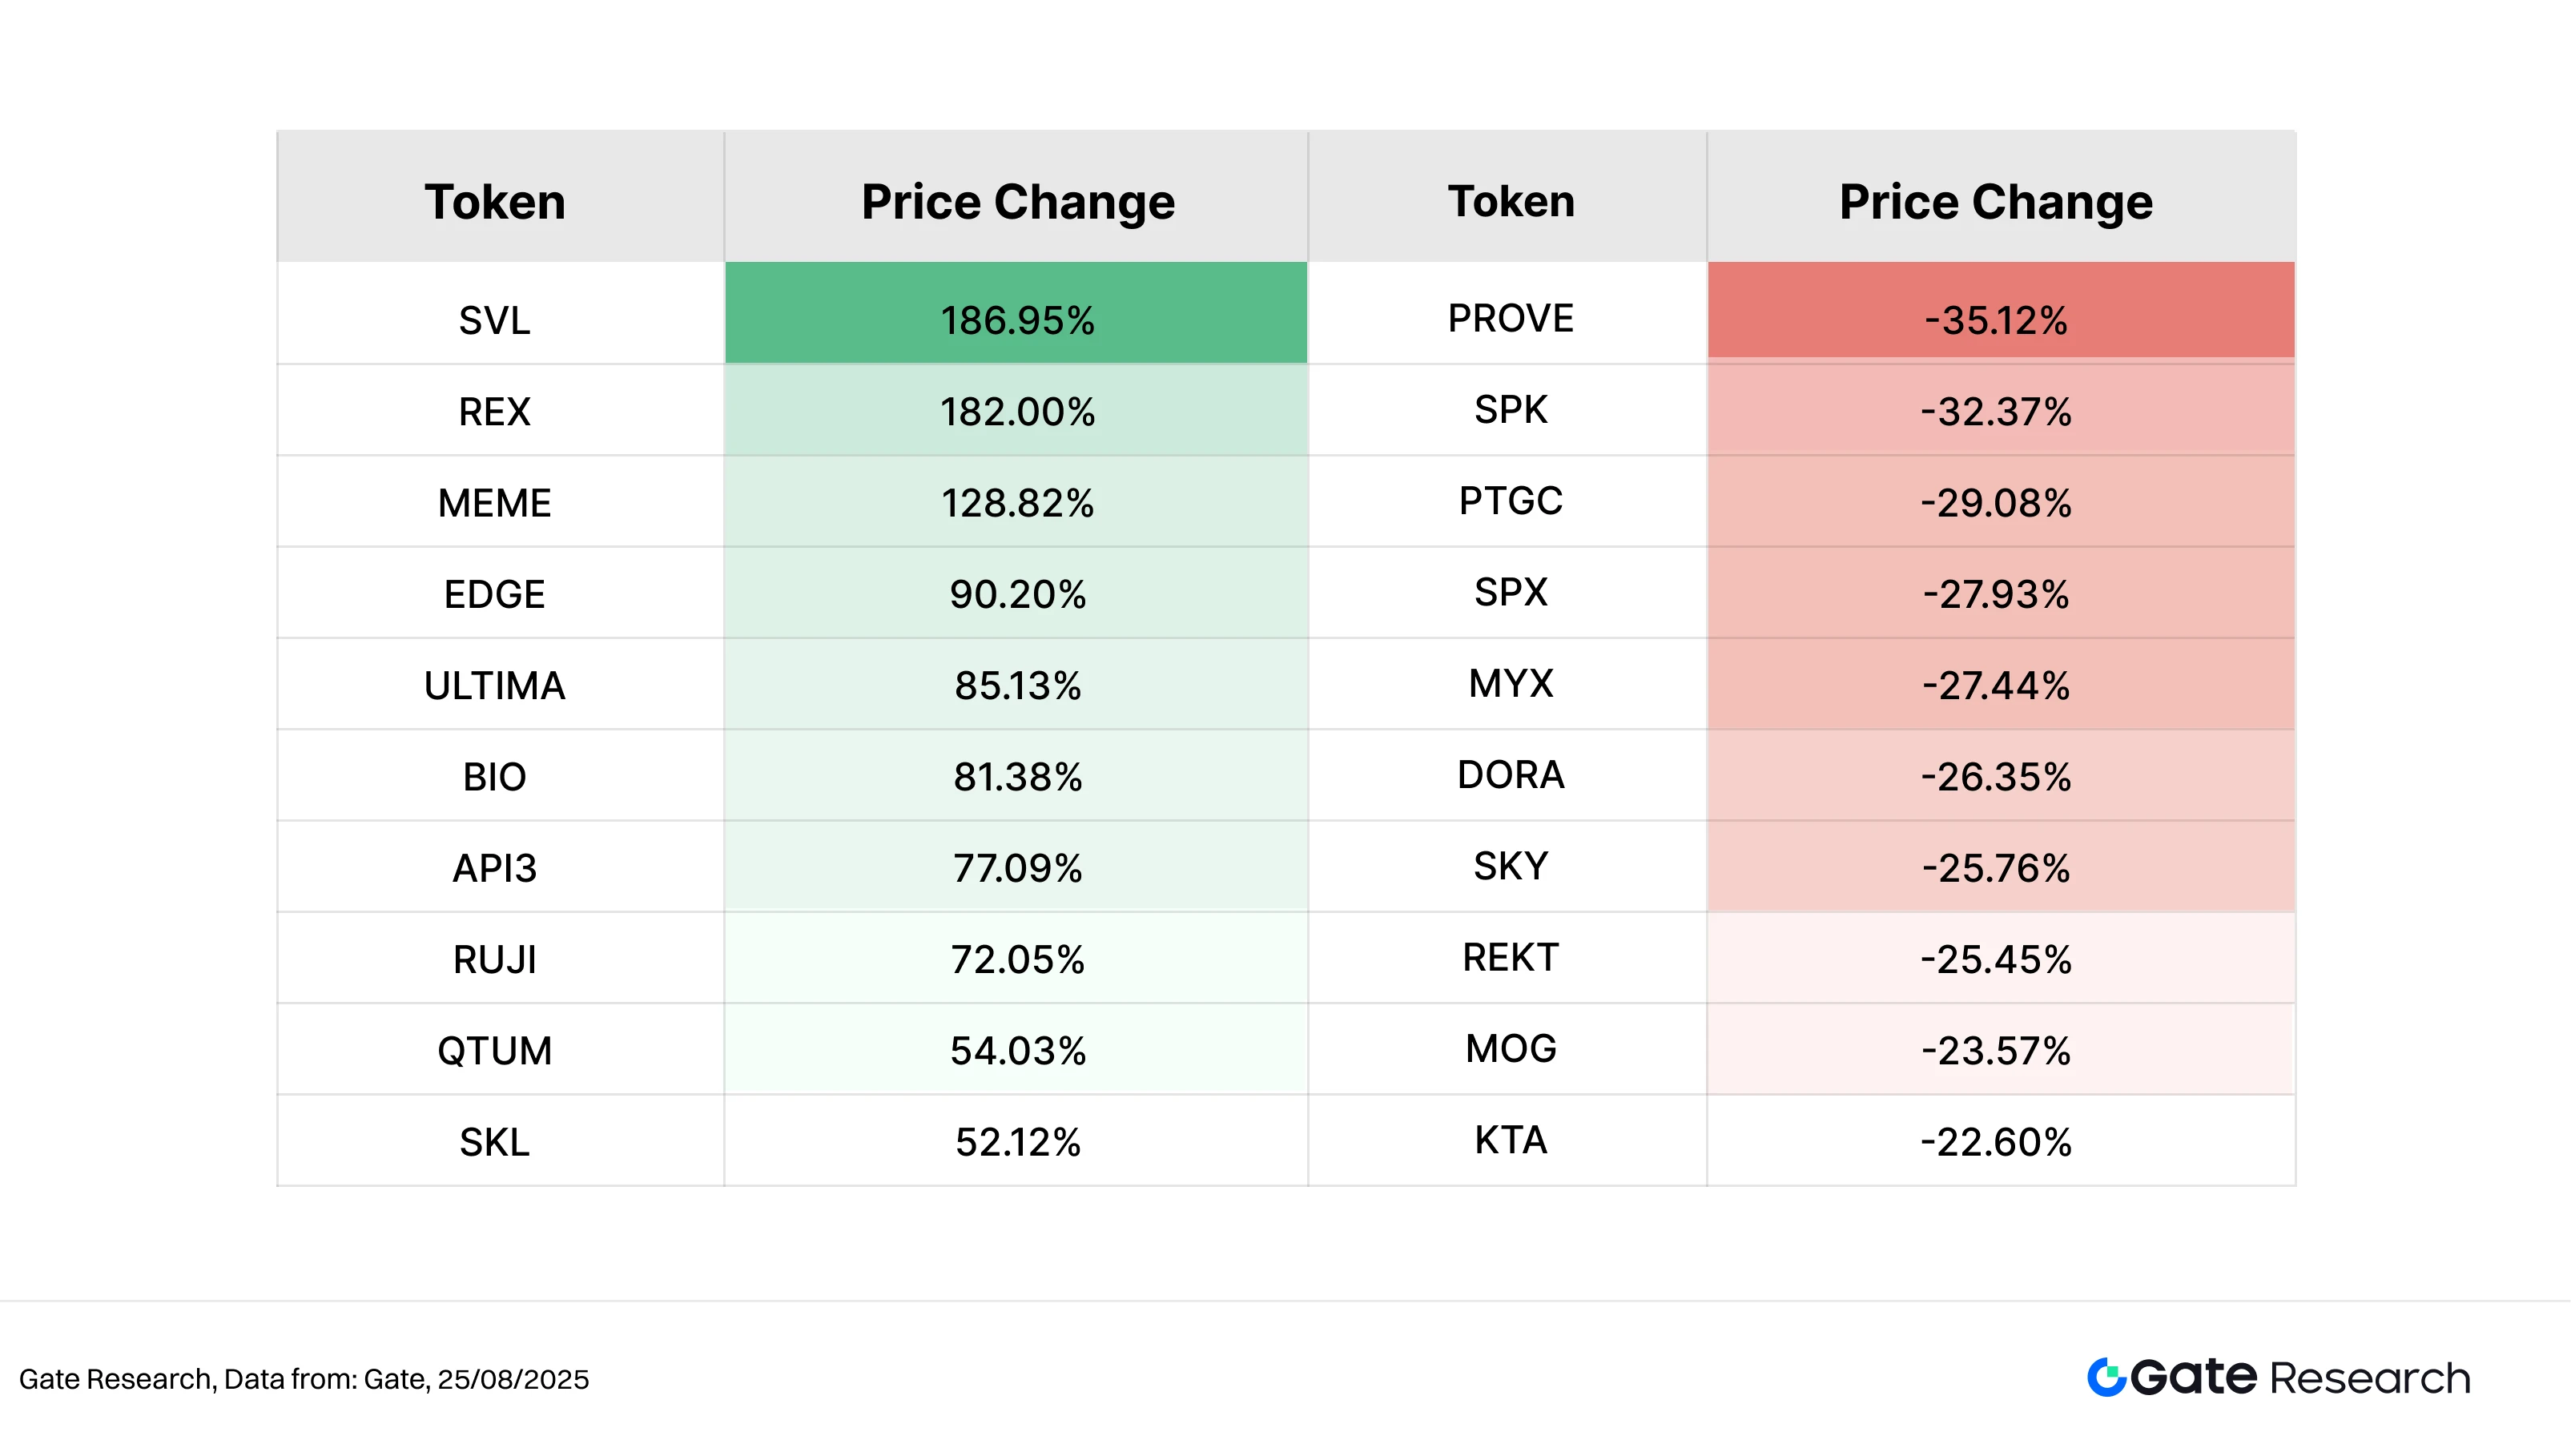
Relationship Between Market Cap Ranking and Price Performance
To further analyze the structural characteristics of token performance in the current market cycle, a scatter plot was created for the top 500 tokens by market cap. The horizontal axis represents market cap ranking (with larger-cap tokens to the left), while the vertical axis shows the price change from August 12 to August 25, displayed on a logarithmic scale. Each dot represents one token—green for gainers and red for losers.
From the overall distribution, approximately 48% of tokens posted gains, slightly fewer than those that declined. This suggests that while market sentiment is showing signs of recovery, it remains within a rotational structure rather than a broad-based rally. Most gains were concentrated in the +5% to +100% range, with mid- to lower-cap assets leading the way—particularly SVL, REX, and MEME, all of which gained over 100%.
SVL stood out due to the conclusion of its crypto credit card promotional campaign, the card’s regulatory compliance in Japan, and the token’s tight linkage to platform revenue-sharing, which drew strong market attention and positioned it as a high-beta favorite during this rotation.
In contrast, most tokens on the losers list suffered declines of 20%–35%, primarily due to a lack of narrative support or fading market sentiment. Examples include PROVE, SPK, TIBBIR, KTA, and DORA. PROVE, despite gaining early traction from multiple exchange listings, failed to maintain momentum as buying interest quickly faded, leading to a sharp price drop and making it the biggest loser during this period.
Overall, capital flows are clearly favoring small- and mid-cap tokens with strong narratives and thematic clarity, while major assets saw only mild movements. Tokens without ongoing narratives are being increasingly marginalized. The market remains in a sector-rotation phase, with structural trends likely to dominate short-term performance.
Figure 3: Among the top 500 tokens, fewer than half recorded gains. Market capital is clearly favoring small- to mid-cap tokens with compelling narratives and high volatility.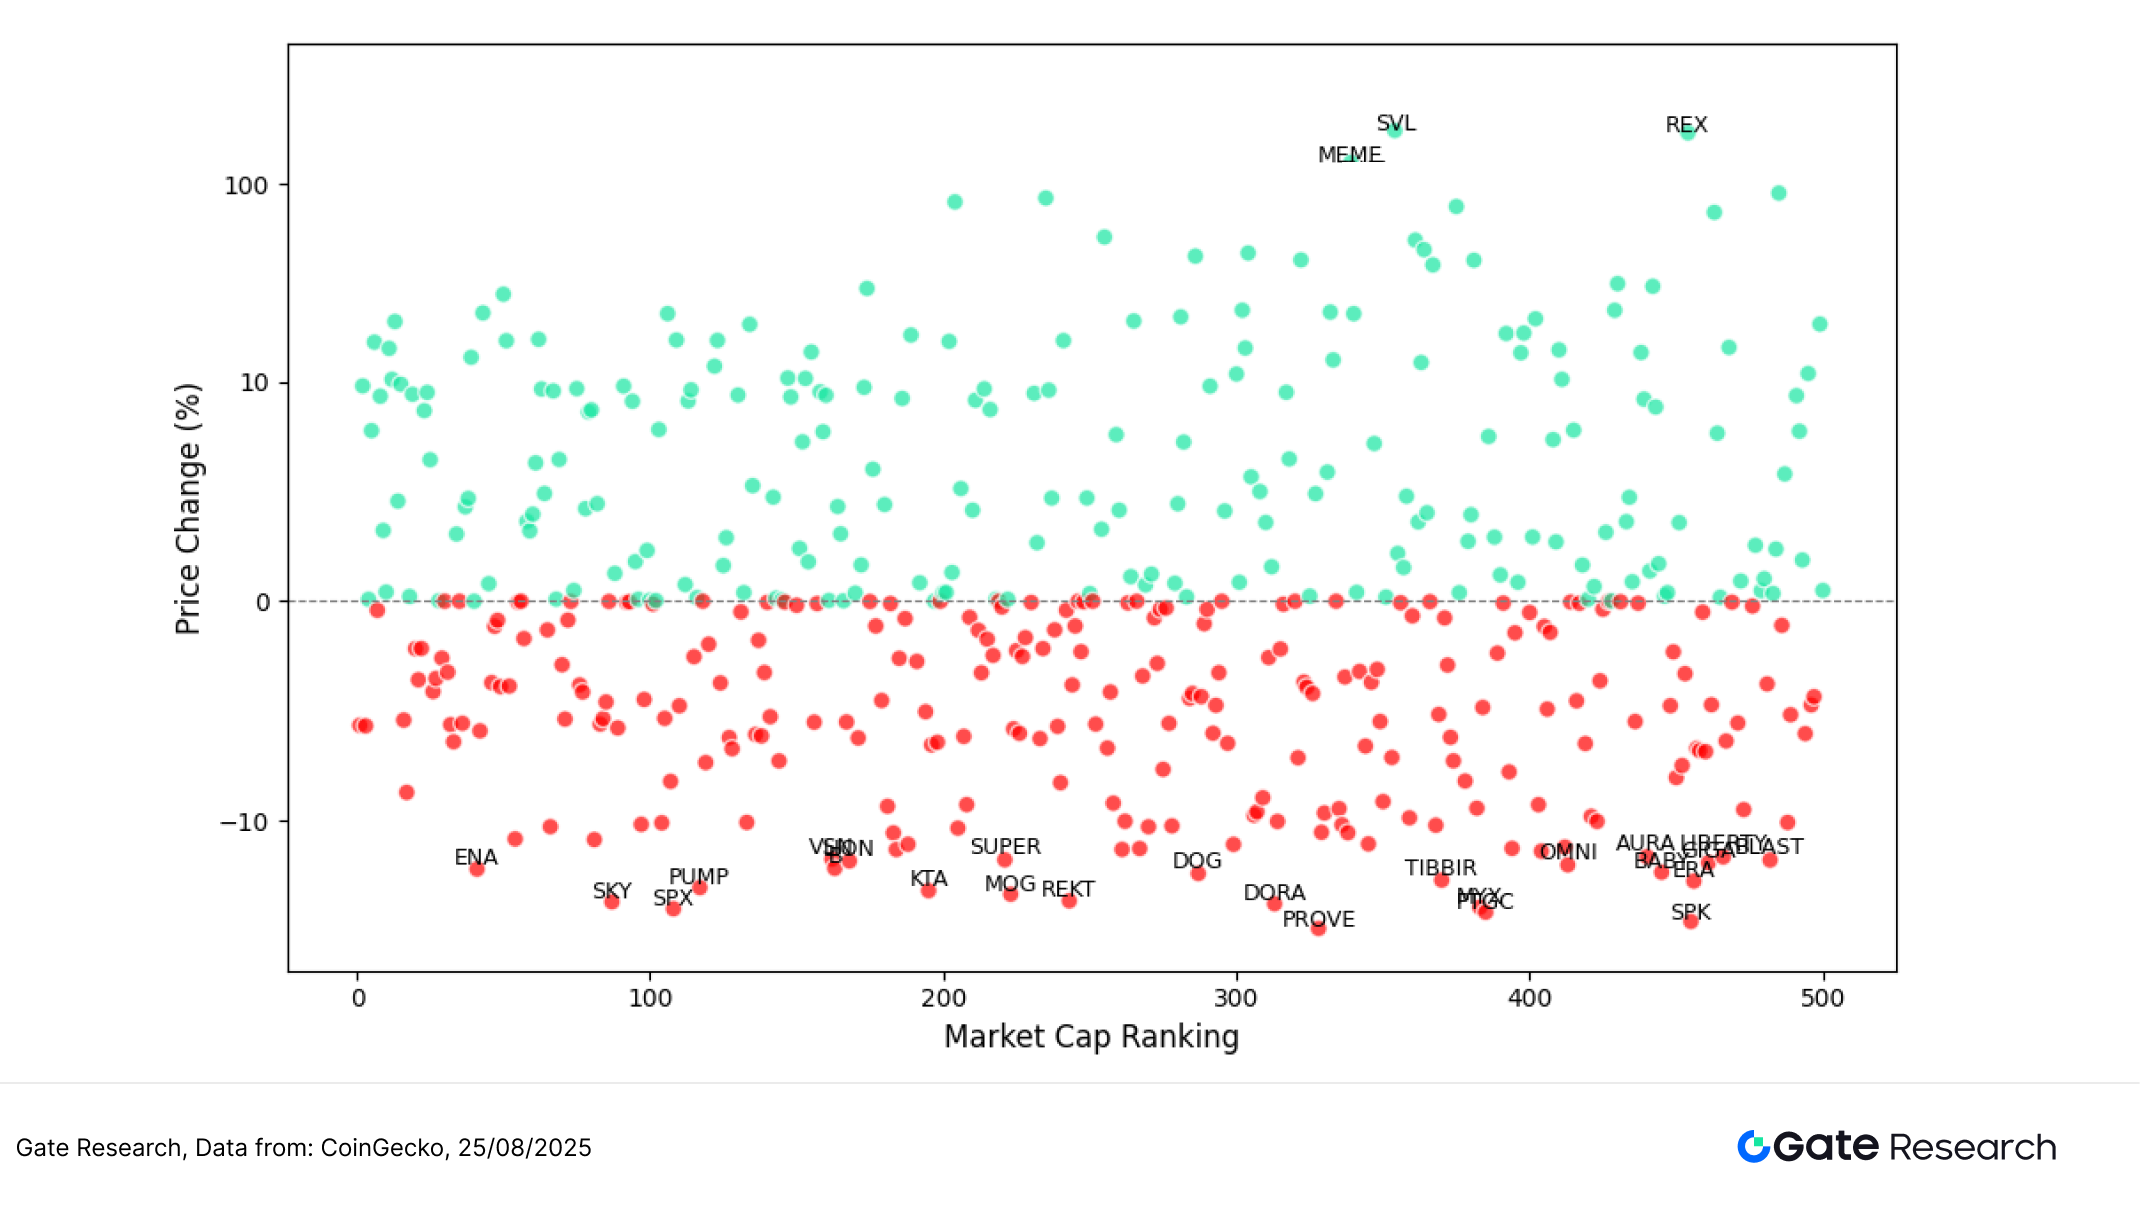
Top 100 Market Cap Leaders
During the current phase of market consolidation, the top 100 tokens by market cap have shown reduced volatility, reflecting a clearly defensive market posture. Excluding stablecoins and LSD tokens, only about ten tokens posted gains, indicating weak follow-through buying and a shift in capital preference toward observation and portfolio defense rather than aggressive positioning. The top five gainers were: MNT (+2.99%), HASH (+1.84%), XDC (+0.77%), LEO (+0.11%), and TRX (+0.02%).
Most of these gains were relatively modest, with no clear leading sector emerging. Only MNT and HASH stood out slightly, likely supported by ecosystem developments and public chain narratives. Specifically, MNT (Mantle Network) recently surpassed $714 million in on-chain stablecoin supply, representing a year-over-year increase of over 210%. It also published a list of its top 10 dApps by TVL, including well-known protocols like Pendle, Merchant Moe, and Treehouse, signaling the early formation of a financialized Layer 2 ecosystem and drawing increased investor attention.【3】
On the downside, losses were generally mild. The top five decliners were: IP (-4.28%), PI (-3.65%), PENGU (-3.34%), ENA (-2.12%), and BONK (-2.11%). These declines were likely caused by waning narratives or insufficient buying demand, with no signs of panic selling, suggesting that large-cap assets remain resilient.
In summary, the top 100 tokens displayed a range-bound structure with few gainers and moderate pullbacks. Capital remains focused on high-certainty, liquid assets, and structural rotation has yet to impact large-cap tokens. In the short term, the market is likely to continue in a defensive consolidation mode led by cautious capital allocation.
Figure 4: Price gains among the top 100 tokens were limited, with the overall trend remaining flat. Only a few tokens showed slight outperformance, reflecting low market enthusiasm and a shift toward risk-off sentiment.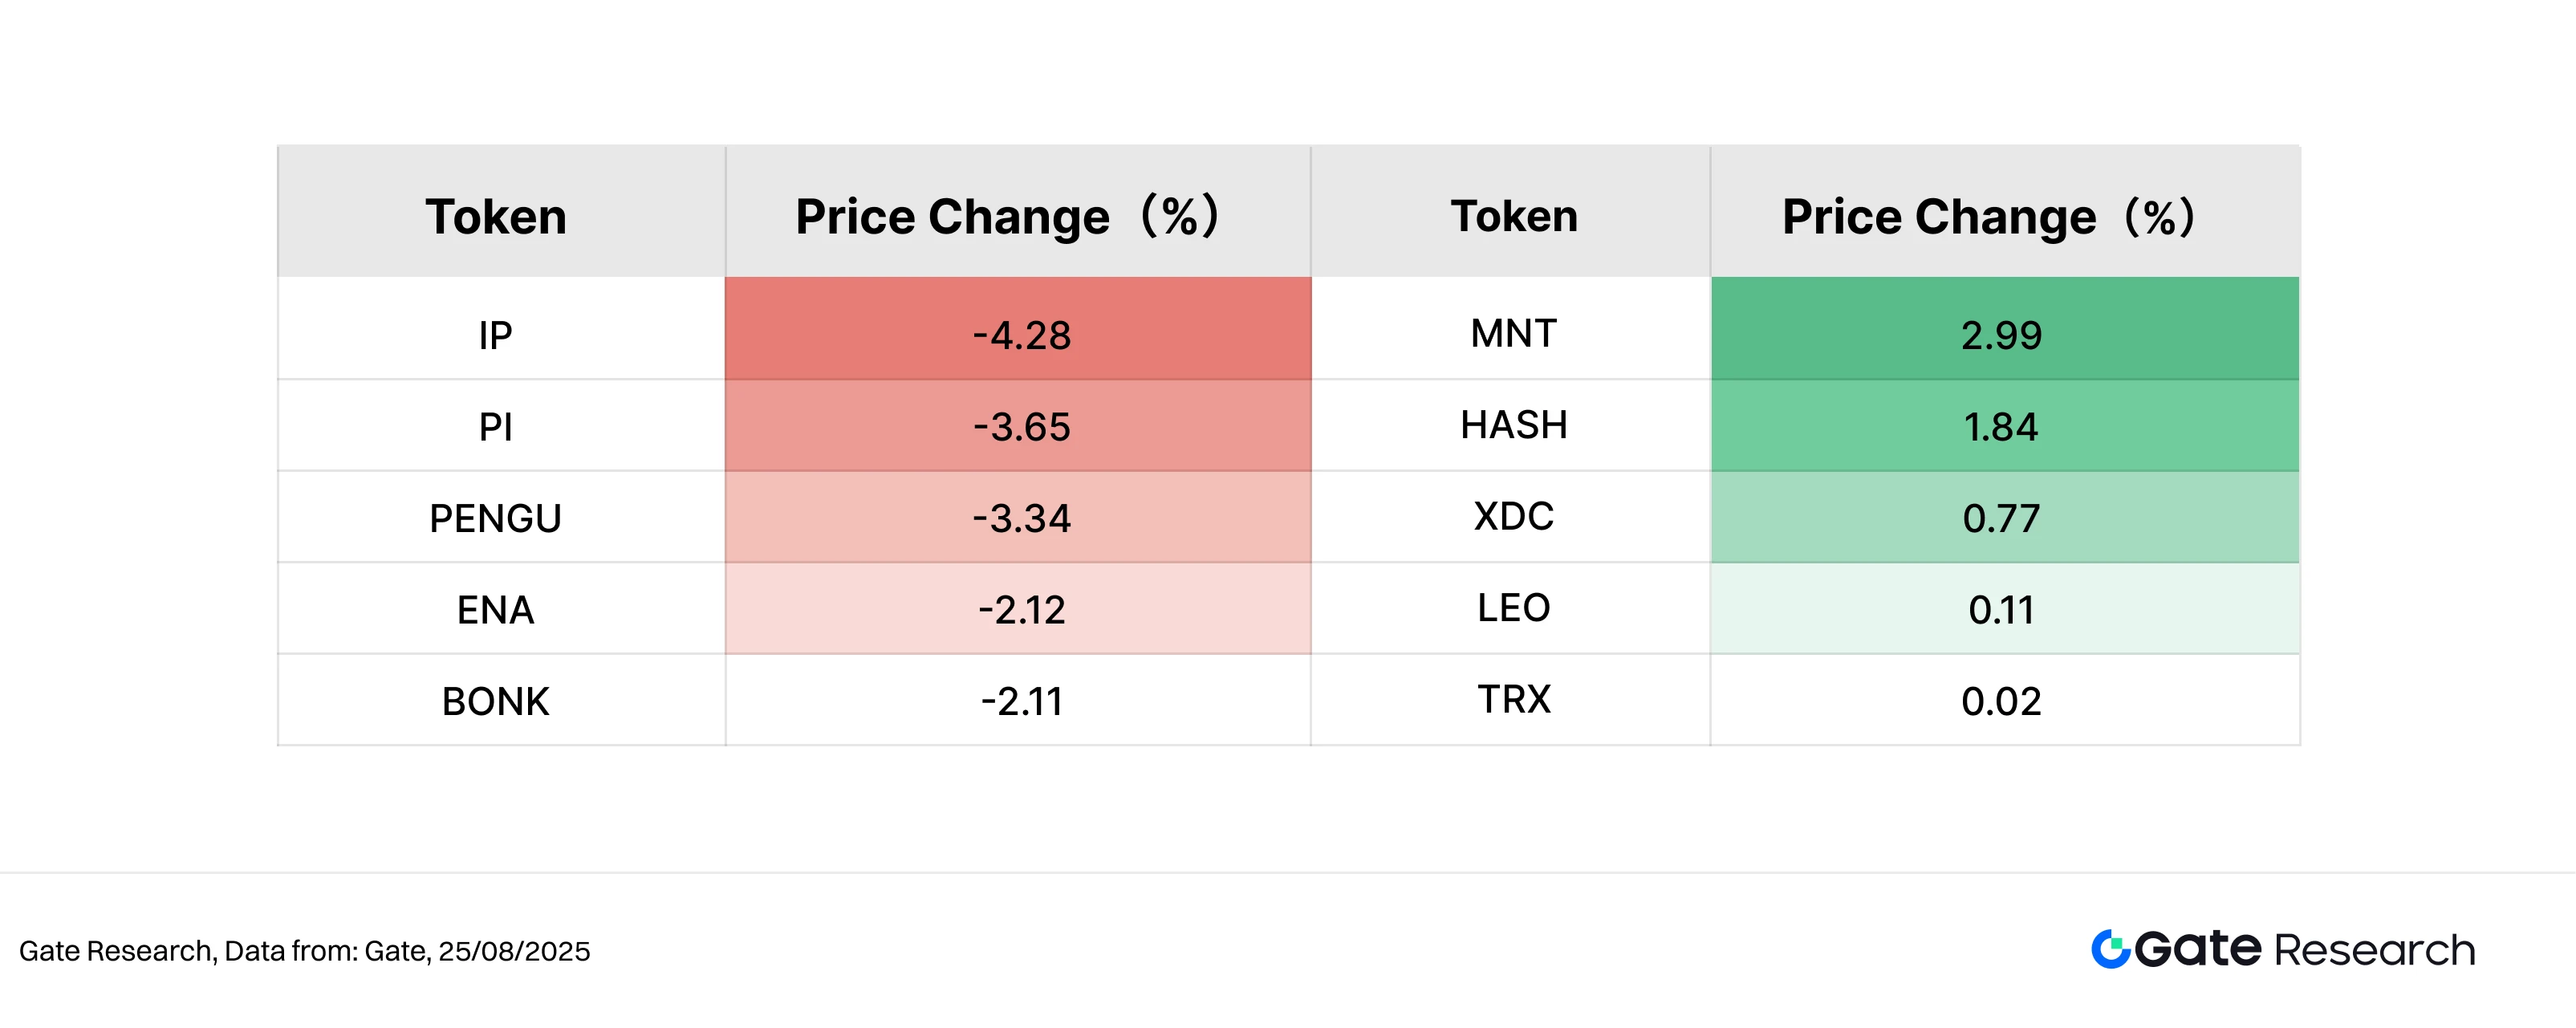
2. Volume Surge Analysis
Trading Volume Growth Analysis
Building on the analysis of token price performance, this report further examines trading volume changes for select tokens during the current market cycle. Using pre-rally trading volume as a baseline, we calculated the volume growth multiple as of August 25 to gauge shifts in market attention and trading activity.
The data shows that ONYX recorded the highest volume increase at 22.45x, yet its price rose by only 0.49%. This suggests that while the market temporarily focused on ONYX, price momentum lagged, possibly due to selling pressure or high turnover. KOGE also saw a 10.33x increase in volume, but experienced a slight price decline, illustrating that a surge in volume does not always coincide with upward price action.
More notable were BAND, BIO, and API3, which registered volume increases of 9.86x, 9.51x, and 9.19x, respectively, alongside significant price gains of +41.23%, +81.38%, and +77.09%. These tokens exhibited strong price-volume resonance, indicating sustained capital inflows. Both BIO and API3 are ranked within the 200–300 market cap range, making them ideal targets for rotational capital — liquid but not overcrowded, with compelling narratives.
Structurally, this round of volume spikes was concentrated in mid- and low-cap tokens, and there appears to be a correlation between trading activity and price performance, suggesting that the market is engaging in narrative-driven short-term speculation. Sudden surges in volume are often precursors to broader market attention and serve as valuable indicators for identifying potential rotation targets.
Figure 5: ONYX, BAND, BIO, API3 and others saw significant volume spikes. The latter three also experienced strong price gains, highlighting “price-volume alignment” and growing short-term capital interest.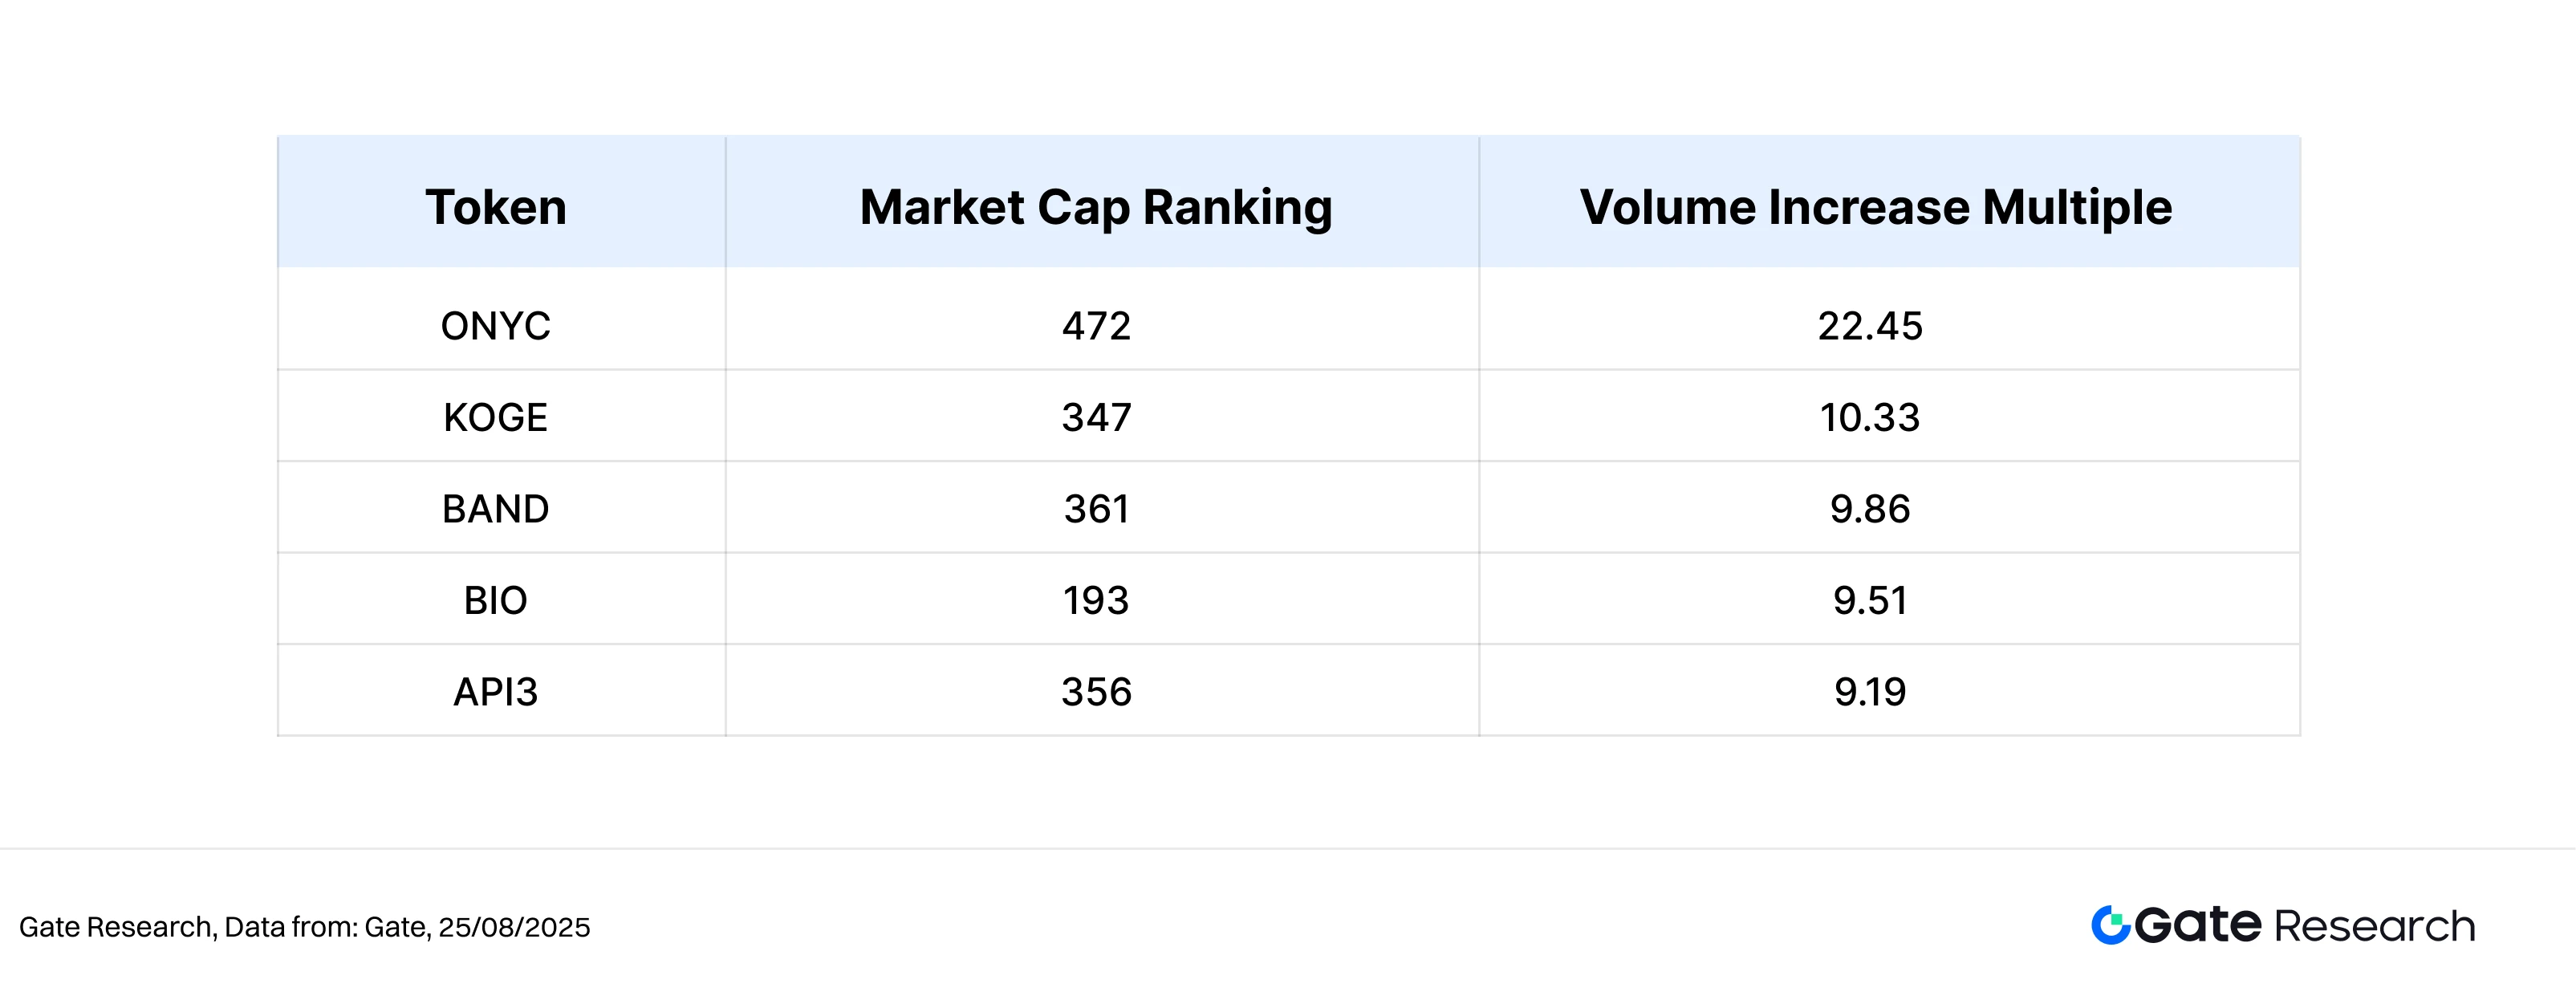
Volume-Price Relationship Analysis
Building on the previous analysis of abnormal volume activity, this section introduces a scatter plot mapping the relationship between Volume Increase Multiple and Price Change (%). The horizontal axis represents the growth multiple of each token’s trading volume over the past two weeks compared to its baseline period, while the vertical axis shows the corresponding price change over the same period. A symmetrical log scale is used to clearly display extreme changes in both directions.
The chart reveals that the top-right quadrant is populated by tokens exhibiting a clear “volume surge + price increase” pattern. Notably, BIO and BAND recorded volume growth of 9.51x and 9.86x, with price gains of +81.38% and +41.23%, respectively—highlighting strong capital inflows and improved price elasticity, making them representative examples of volume-price resonance. API3 also performed well, with nearly 9x volume growth and a +77% price gain, fitting the profile of a structurally driven rotation play.
In contrast, the bottom-right quadrant includes tokens like KOGE and ONYX, which saw significant volume increases—10x and 22x, respectively—but failed to deliver meaningful price gains. This suggests that while these tokens attracted short-term trading attention, the lack of narrative strength or capital continuity limited their upward momentum, resulting in a “volume without price” dynamic.
Additionally, tokens like MEME and RUJI, despite being small-cap, posted exceptionally high price gains, some accompanied by notable volume spikes. This underscores the market’s continued preference for high-volatility, narrative-driven tokens in the short term.
Overall, tokens in the top-right quadrant tend to have clear catalysts (such as ecosystem developments, exchange listings, or strengthened narratives) and adequate liquidity, making them prime targets for capital rotation in this structurally-driven market phase. In contrast, those in the bottom-right quadrant may show trading activity but suffer from price divergence, reflecting a market shift from pure sentiment trading toward narrative quality and sustained capital support.
Figure 6: Tokens like BIO, BAND, and API3 fall within the top-right quadrant, exemplifying the “volume-backed rally” pattern and serving as key targets for short-term capital rotation.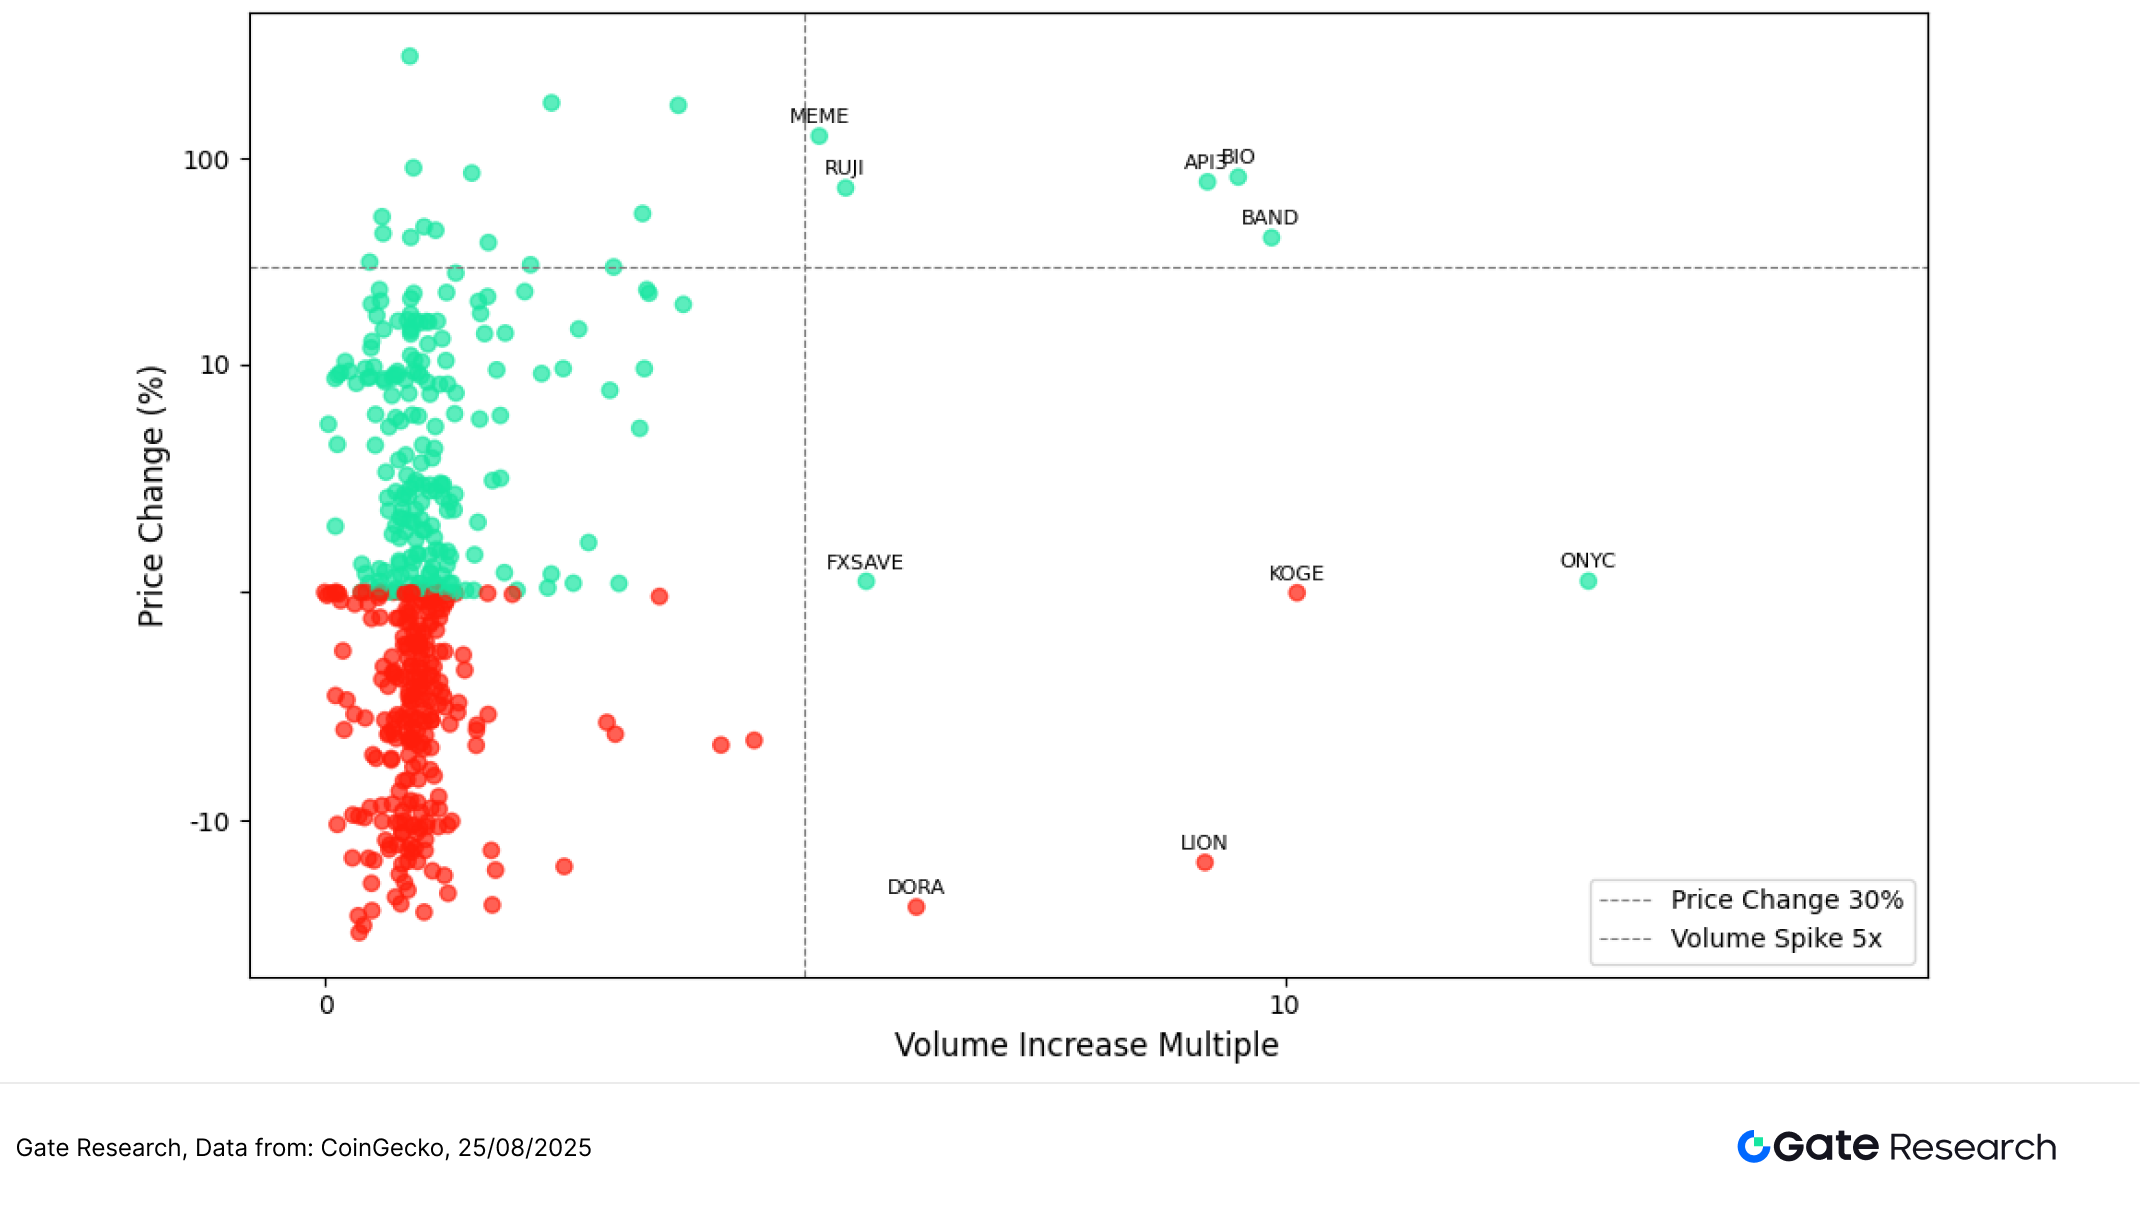
Correlation Analysis
After exploring the relationship between trading volume changes and price performance, this section further examines the structural linkage between the two from a statistical perspective. To assess whether capital activity systematically influences price fluctuations, we introduce the “Volume-to-Market Cap Ratio” as a measure of relative trading activity, and calculate its correlation with price change. This analysis helps identify which tokens are more sensitive to capital flows and provides insight into the strength of volume-price interaction in the current market.
The chart shows that the majority of tokens exhibit correlation coefficients between 0.65 and 0.85, indicating a generally positive relationship between trading activity and price movements. In the chart, bubble color represents the correlation strength (red = strong, blue = weak), while bubble size reflects the token’s market cap, allowing for visual comparison of volume-price behavior across different asset tiers.
Tokens in the upper-left quadrant, such as QTUM and CFG, have the highest correlation coefficients (mostly in the 0.82–0.86 range), suggesting that these mid- to small-cap assets tend to move more in sync with trading volume, forming high-beta volume-price linkage structures. These are often preferred by short-term traders. Notably, RSETH appears as the largest bubble in this region, indicating it has significant market cap and strong price elasticity, making it a standout target in high-volatility environments.
By contrast, tokens on the right side of the chart such as GT, USD1, and UMA show lower correlation coefficients (around 0.65–0.70) despite being highly traded. This implies their prices are less sensitive to changes in volume. Among them, GT stands out with a large market cap (large bubble size), suggesting that while it lacks high-frequency price responsiveness, it offers depth and stability, potentially making it more suitable for long-term capital or institutional participation.
In summary, mid- and small-cap tokens generally exhibit higher price elasticity and stronger volume-price linkage, whereas large-cap tokens offer liquidity but more muted price reactions, reflecting a structural divergence in market behavior between risk-seeking traders and long-term investors. Short-term participants tend to favor high-correlation, high-volatility assets, while long-term capital leans toward stable, moderately responsive holdings.
Figure 7: QTUM, CFG and other mid-cap tokens show strong volume-price correlation, reacting significantly to capital inflows. In contrast, large-cap assets like GT show weaker correlation but greater size and price stability.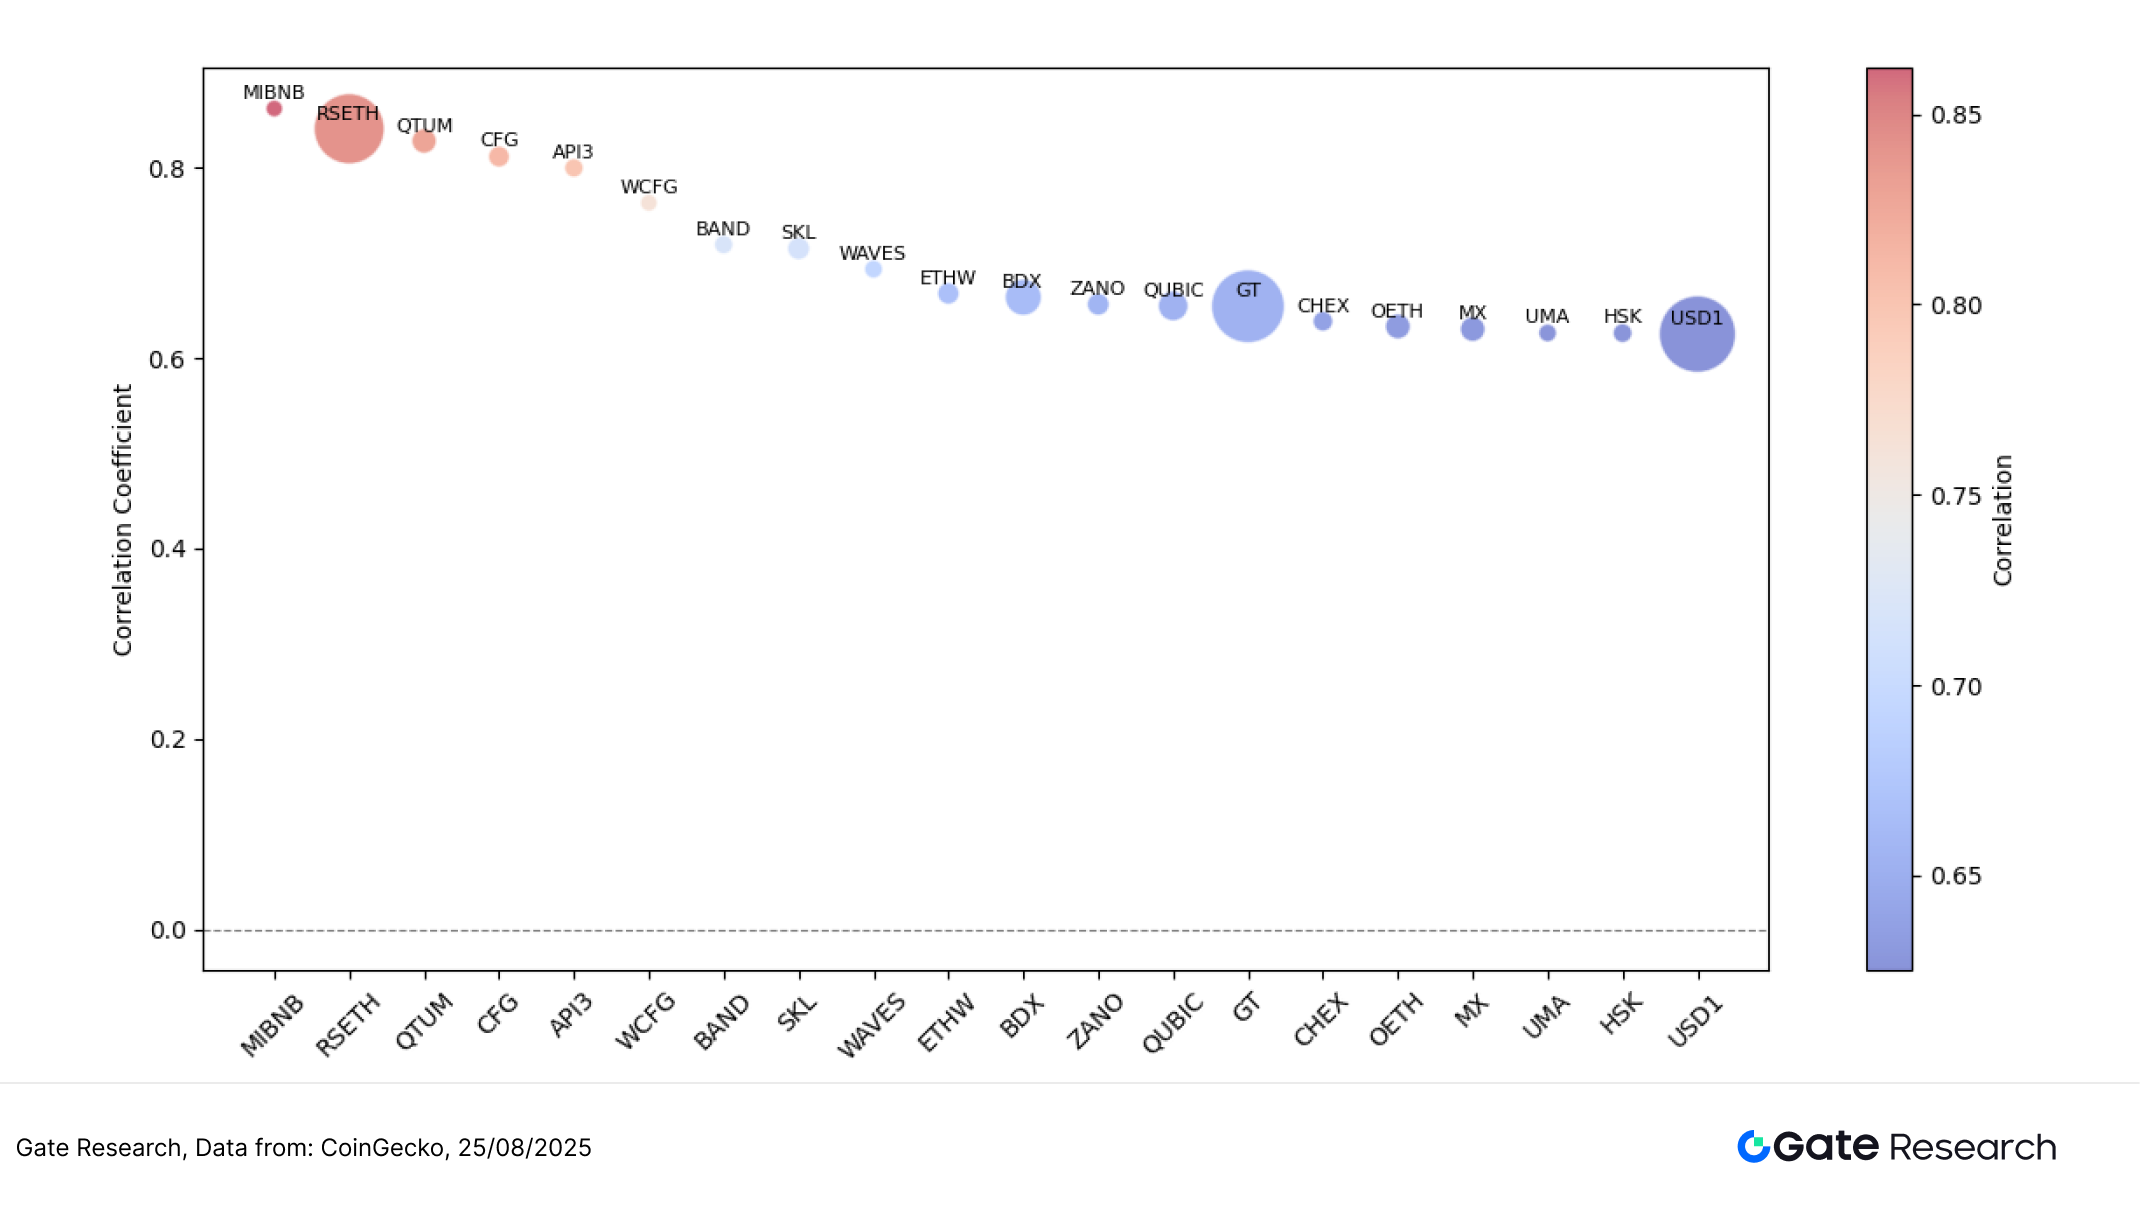
In summary, the current crypto market displays a pattern of “structural divergence and narrative-driven rotation,” with volume-price correlation signals becoming increasingly prominent. Mid- and small-cap tokens such as BIO and MEME delivered notable gains amid surging trading volumes, emerging as key focal points in short-term capital flows. In contrast, large-cap tokens like GT maintained relatively stable price action, attracting interest from more risk-averse, long-term investors.
Beyond market performance, multiple potential airdrop campaigns are actively progressing across high-interest sectors such as social incentive platforms, restaking protocols, emerging Layer 1 testnets, and smart asset management tools. Users who engage early and consistently complete interaction tasks may position themselves ahead of the curve to capture future token rewards and airdrop eligibility during market consolidation. The following section outlines four early-stage projects worth watching and provides guidance on how to participate—helping users strategically tap into upcoming Web3 incentive opportunities.
Airdrop Highlights
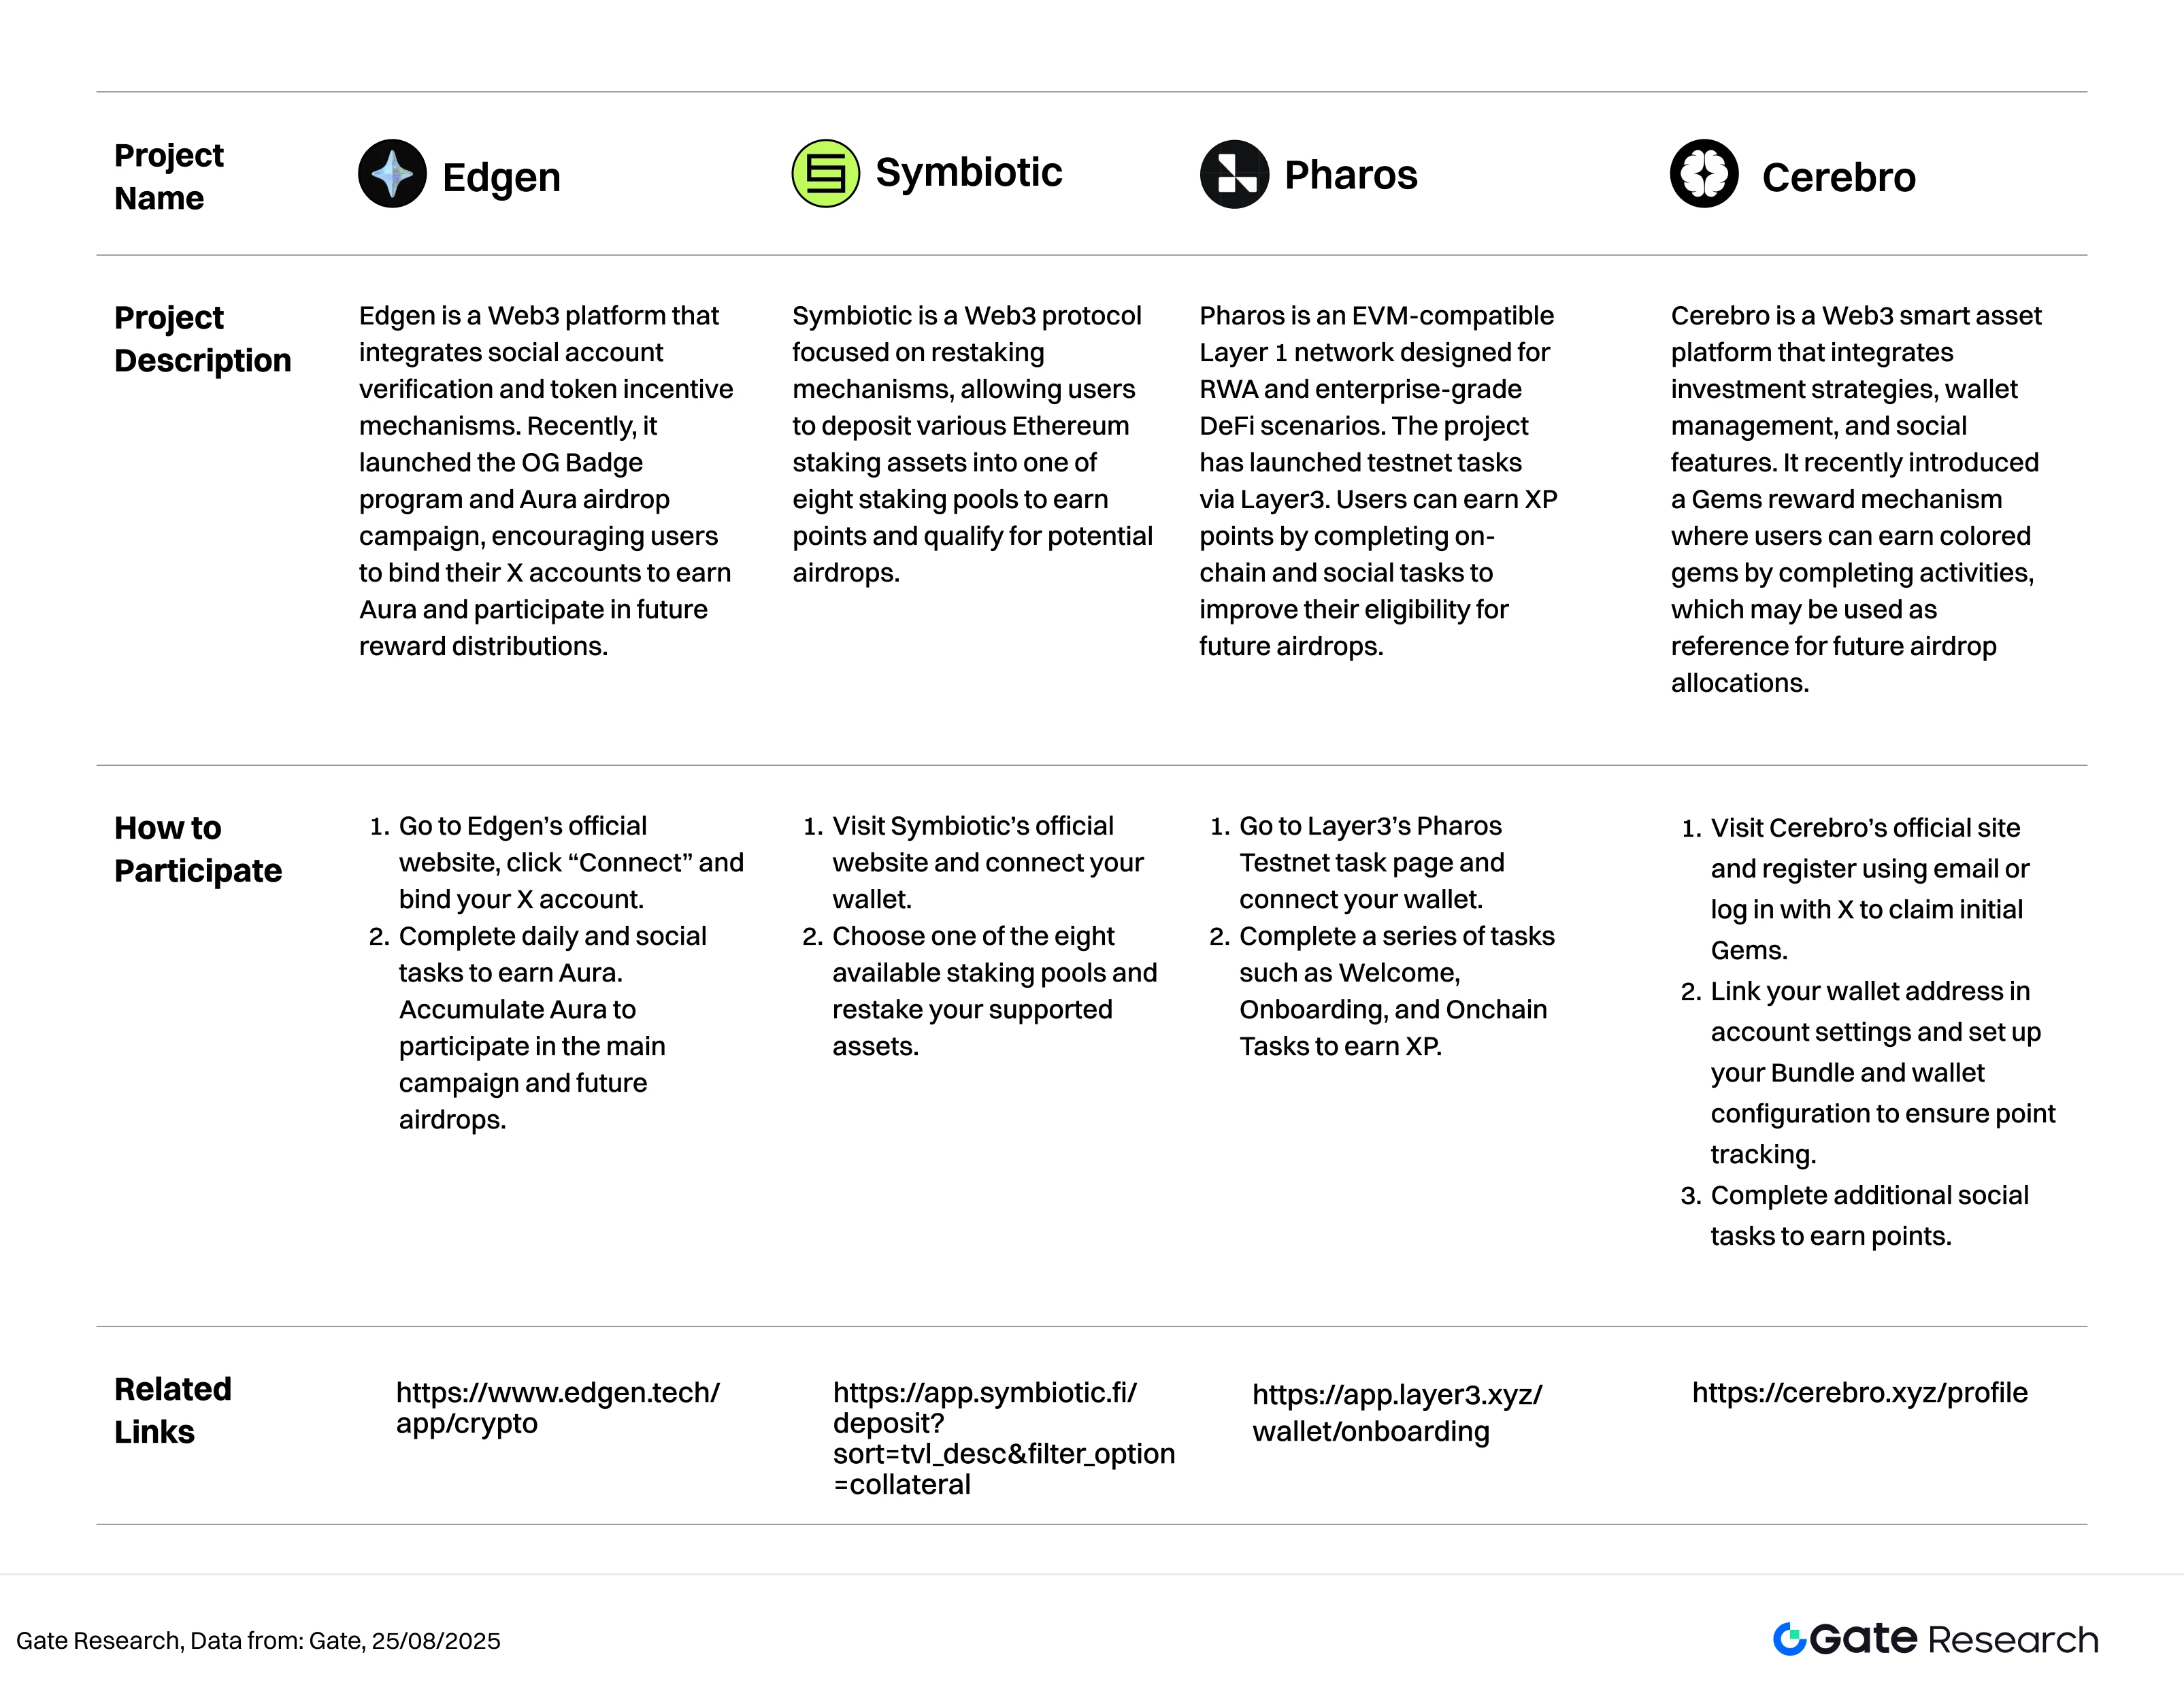
This report highlights key airdrop prospects between August 12 and August 25, 2025, focusing on several early-stage projects showing strong momentum. These include Edgen (an interactive platform combining social account binding with token incentives), Symbiotic (a restaking protocol for Ethereum LSD assets), Pharos (an EVM-compatible Layer 1 network designed for RWA and enterprise-grade DeFi applications), and Cerebro (a smart asset platform integrating investment strategies and wallet management).
Users can accumulate early participation credentials by registering accounts, linking wallets and social profiles, completing tasks, and performing staking actions. The following sections will summarize each project’s positioning, recent incentive mechanisms, and main user interaction flows—aimed at helping users seize potential Web3 reward opportunities during this early-stage airdrop window.
Edgen
Edgen is a Web3 platform that integrates social account verification and token incentive mechanisms. Recently, it launched the OG Badge program and Aura airdrop campaign, encouraging users to bind their X accounts to earn Aura and participate in future reward distributions.【4】
How to Participate:
- Go to Edgen’s official website, click “Connect” and bind your X account.
- Complete daily and social tasks to earn Aura. Accumulate Aura to participate in the main campaign and future airdrops.
Symbiotic
Symbiotic is a Web3 protocol focused on restaking mechanisms, allowing users to deposit various Ethereum staking assets into one of eight staking pools to earn points and qualify for potential airdrops.【5】
How to Participate:
- Visit Symbiotic’s official website and connect your wallet.
- Choose one of the eight available staking pools and restake your supported assets.
Pharos
Pharos is an EVM-compatible Layer 1 network designed for RWA and enterprise-grade DeFi scenarios. The project has launched testnet tasks via Layer3. Users can earn XP points by completing on-chain and social tasks to improve their eligibility for future airdrops.【6】
How to Participate:
- Go to Layer3’s Pharos Testnet task page and connect your wallet.
- Complete a series of tasks such as Welcome, Onboarding, and Onchain Tasks to earn XP.
Cerebro
Cerebro is a Web3 smart asset platform that integrates investment strategies, wallet management, and social features. It recently introduced a Gems reward mechanism where users can earn colored gems by completing activities, which may be used as reference for future airdrop allocations.【7】
How to Participate:
- Visit Cerebro’s official site and register using email or log in with X to claim initial Gems.
- Link your wallet address in account settings and set up your Bundle and wallet configuration to ensure point tracking.
- Complete additional social tasks to earn points.
Reminder
Airdrop plans and participation methods are subject to change at any time. Therefore, it is recommended that users follow the official channels of the above projects for the latest updates. Additionally, users should exercise caution, be aware of the risks, and conduct thorough research before participating. Gate does not guarantee the distribution of subsequent airdrop rewards.
Conclusion
Reviewing the market cycle from August 12 to August 25, 2025, the crypto market exhibited a classic pattern of “structural divergence and narrative-driven rotation,” with volume-price correlation signals strengthening noticeably. On the technical side, ETH reached a new all-time high, breaking through 4,900 USDT, reaffirming its strong trend continuation capability among major assets.
Mid- and small-cap tokens like BIO and BAND showed a high degree of price responsiveness to volume surges, becoming focal points for short-term speculation and narrative-driven trading. This reflects a temporary recovery in risk appetite. Meanwhile, large-cap assets such as GT remained relatively stable, acting as liquidity anchors in a structurally segmented market—more suited for long-term or institutional capital deployment.
From a data perspective, tokens ranked 301–400 by market cap delivered the strongest performance, suggesting that in periods when large caps come under pressure, smaller projects offer greater upside and flexibility. Further analysis reveals that the “Volume-to-Market Cap” ratio has a strong positive correlation with price performance, with most correlation coefficients falling in the 0.65–0.85 range, confirming that trading activity is becoming a key driver of price momentum.
Overall, capital is increasingly rotating into high-activity, narrative-rich mid- and small-cap tokens, making structural opportunities and narrative momentum the dominant forces shaping short-term market dynamics. Meanwhile, mainstream assets remain in a consolidation phase, with future trends hinging on clearer technical breakouts or macro catalysts.
In addition, this period tracked several early-stage projects—Edgen, Symbiotic, Pharos, and Cerebro—spanning social incentive platforms, restaking protocols, emerging Layer 1 networks, and smart asset management tools. These projects feature clear user task flows and active incentive mechanisms, all currently in early reward distribution phases. Users can earn points and increase their airdrop eligibility by registering accounts, linking wallets and social profiles, completing tasks, or running nodes. Continued participation not only enhances potential token rewards but also offers a strategic opportunity to position early for future Web3 growth dividends.
Reference:
- CoinGecko, https://www.coingecko.com/
- X, https://x.com/SlashWeb3/status/1960139027933475303
- X, https://x.com/Mantle_Official/status/1958595146968432999
- Edgen, https://www.edgen.tech/app/crypto
- Symbiotic, https://app.symbiotic.fi/deposit?sort=tvl_desc&filter_option=collateral
- Pharos, https://app.layer3.xyz/wallet/onboarding
- Cerebro, https://cerebro.xyz/profile
Gate Research is a comprehensive blockchain and cryptocurrency research platform that provides deep content for readers, including technical analysis, market insights, industry research, trend forecasting, and macroeconomic policy analysis.
Disclaimer
Investing in cryptocurrency markets involves high risk. Users are advised to conduct their own research and fully understand the nature of the assets and products before making any investment decisions. Gate is not responsible for any losses or damages arising from such decisions.
Related Articles

12 Best Sites to Hunt Crypto Airdrops in 2025

Top 20 Crypto Airdrops in 2025

Gate Research: BTC Breaks $100K Milestone, November Crypto Trading Volume Exceeds $10 Trillion For First Time

Gate Research: 2024 Cryptocurrency Market Review and 2025 Trend Forecast

A Must-Try Project Backed by Binance Labs with Extra Staking Rewards (Step-by-Step Guide Included)
