BTC 當期趨勢與價格區間
圖一爲 BTC/USDT 的日線級別走勢圖,從圖片中可以清楚看到白色水平壓力帶所標示的價格阻力區間在 2025 年 5 月被觸及後,價格隨即出現了顯著的回調,要注意的是,在 2025 年 2 月期間,價格也曾在此區間附近經歷了一段盤整,未來則需留意成交量以及價格走勢是否做出突破或是跌破盤整區間的動作。

(圖一,來源:TradingView 2025.5.6)
BTC 重點關注與目標價格
圖二爲 BTC/USDT 的 4 小時線級別走勢圖,圖中的白色區間帶可視爲關鍵的壓力區間,而黃色上升趨勢線則是短線上的重要支撐,綠色水平線則構成了目前盤整區間的下緣支撐。未來,若價格跌破黃色趨勢線,需要重點留意約 92,700 的支撐位,若該支撐失守,價格可能進一步下探至 91,000 附近 ; 相反,若價格能向上突破 96,000 的阻力區間,則可專注於 98,000 - 100,000 的目標區間。
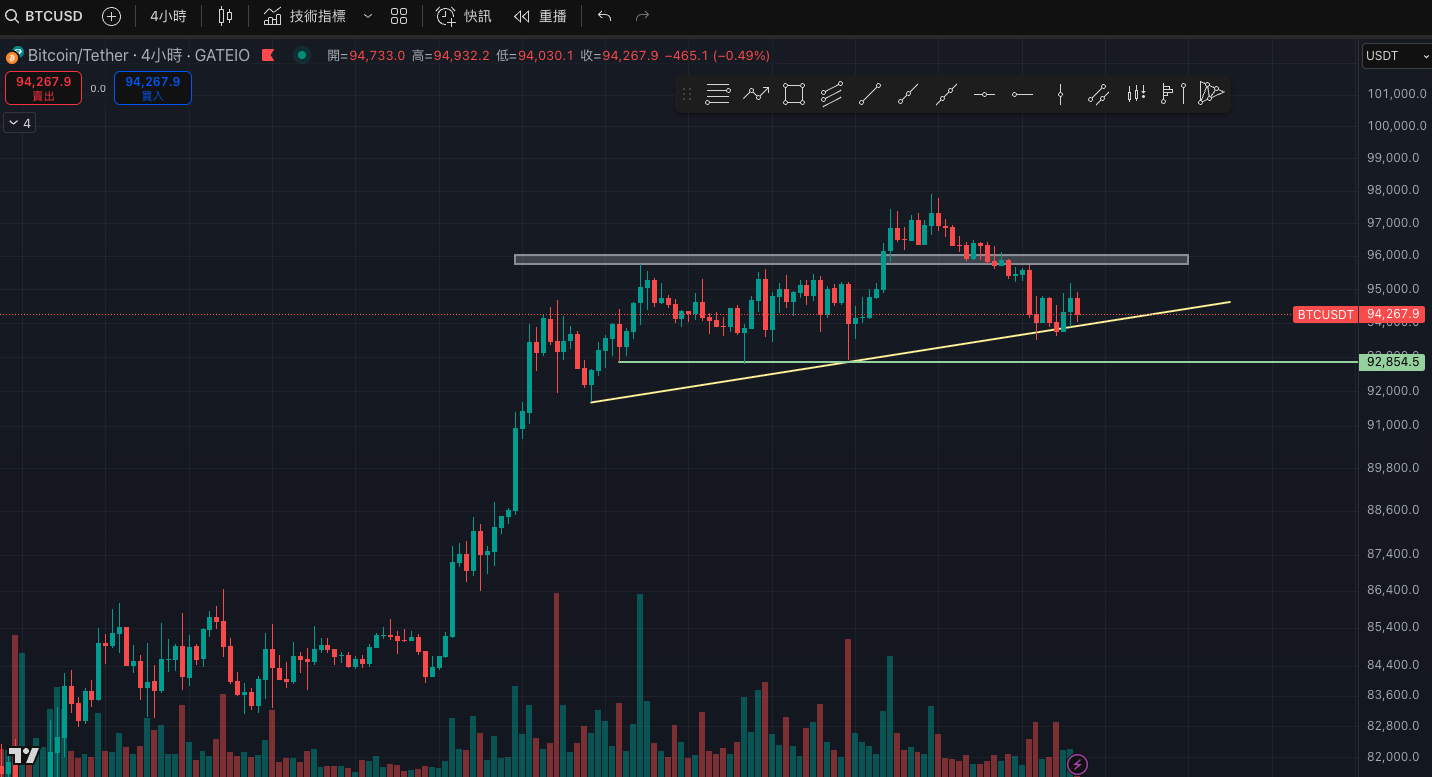
(圖二,來源:TradingView 2025.5.6)
開始進行 BTC 現貨交易:https://www.gate.io/trade/BTC_USDT
總結
眼睛前 BTC 處於關鍵壓力測試階段,若價格無法有效站穩 96,000 美元區間之上,短線仍有回測 92,700 至 91,000 美元支撐的可能,一旦成功突破該壓力帶,市場動能有望推升至 98,000 至 100,000 美元的整數關卡,在趨勢未明朗前,應持續觀察成交量與價格行爲,採取更爲謹慎與彈性的策略應對。
作者: Allen
* 投資有風險,入市須謹慎。本文不作為 Gate 提供的投資理財建議或其他任何類型的建議。
* 在未提及 Gate 的情況下,複製、傳播或抄襲本文將違反《版權法》,Gate 有權追究其法律責任。
相關文章

新手
恒星幣價格預測
本文對 Stellar (XLM) 價格趨勢進行了全面分析,並根據最近的市場數據和專家見解提供了短期、中期和長期預測。它還探討了影響 XLM 價格的因素,包括採用率、合作夥伴關系和市場情緒。此外,文章還強調了 Gate.io 是交易 Stellar 的首選平台,提供安全高效的現貨和期貨交易體驗。
4/17/2025, 1:16:57 AM


新手
Pi Coin KYC 認證全攻略:如何快速通過
KYC 認證不僅是 Pi Coin 項目發展的關鍵一步,更是其實現長期可持續發展的重要保障。通過 KYC 認證,Pi Coin 有望在加密貨幣領域取得更大的突破,為全球用戶帶來更加便捷、安全和創新的數字金融體驗。
2/20/2025, 9:18:29 AM

新手
Baby Doge Price:從 Meme 文化到加密市場新星
Baby Doge Coin 是一種新興的加密貨幣,它在 Doge Coin 的基礎上進行了創新,吸引了大量的粉絲和投資者。憑藉其更快的交易速度、更具吸引力的外觀以及獨特的通縮機制,Baby Doge Coin 在市場上迅速嶄露頭角。本文將詳細介紹 Baby Doge Coin 的起源、機制、如何購買以及它的未來發展方向。
2/19/2025, 8:20:25 AM

新手
Pi 節點:讓每個人都能參與的區塊鏈節點
Pi 節點是 Pi 網絡的重要組成部分,使普通用戶也能參與區塊鏈的交易驗證與共識過程。Pi 節點通過桌面應用程序運行,採用基於 Stellar 共識協議(SCP)的機制,而非傳統的工作量證明(PoW)。節點分為三個參與層級:計算機應用、節點和超級節點,每個層級有不同的責任與功能。Pi 網絡的目標是逐步實現去中心化,未來用戶不僅可以驗證交易,還能貢獻計算資源,參與網絡建設。儘管當前 Testnet 階段沒有直接獎勵,Pi 節點為用戶提供了一個簡便的方式參與區塊鏈發展,並預計未來會引入獎勵機制。
2/21/2025, 10:05:59 AM

新手
Cardano(ADA)走勢分析與未來展望
本文深入分析 Cardano(ADA)在加密貨幣市場中的發展現狀、價格走勢及其未來潛力,Cardano 作為一種基於權益證明(PoS)的區塊鏈平臺,憑藉其創新技術和不斷擴展的生態系統,逐漸成為投資者關注的焦點。
2/26/2025, 8:52:12 AM
即刻開始交易
註冊並交易即可獲得
$100
和價值$5500
理財體驗金獎勵!